Burgstall Blog#
Test#
Beispiel: Markdown + notebooks#
an external image

You can also \(add_{math}\) and
\[
math^{blocks}
\]
or
\[\begin{split}
\begin{align*}
f(x) &= x^2\\
g(x) &= \frac{1}{x}\\
F(x) &= \int^a_b \frac{1}{3}x^3
\end{align*}
\end{split}\]
But make sure you $Escape $your $dollar signs $you want to keep!
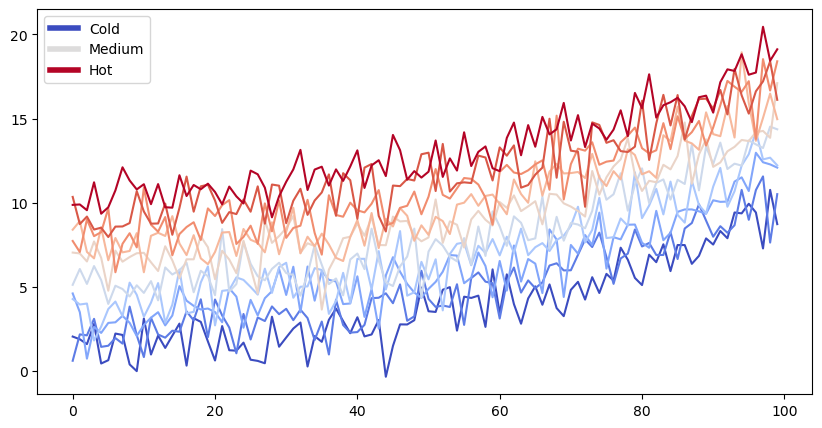
Jupyter Book will also embed your code blocks and output in your book. For example, here’s some sample Matplotlib code:
from matplotlib import rcParams, cycler
import matplotlib.pyplot as plt
import numpy as np
plt
<module 'matplotlib.pyplot' from '/home/stephan/miniconda3/envs/book/lib/python3.12/site-packages/matplotlib/pyplot.py'>
# Fixing random state for reproducibility
np.random.seed(19680801)

N = 10
data = [np.logspace(0, 1, 100) + np.random.randn(100) + ii for ii in range(N)]
data = np.array(data).T
cmap = plt.cm.coolwarm
rcParams['axes.prop_cycle'] = cycler(color=cmap(np.linspace(0, 1, N)))


from matplotlib.lines import Line2D
custom_lines = [Line2D([0], [0], color=cmap(0.), lw=4),
                Line2D([0], [0], color=cmap(.5), lw=4),
                Line2D([0], [0], color=cmap(1.), lw=4)]

fig, ax = plt.subplots(figsize=(10, 5))
lines = ax.plot(data)
ax.legend(custom_lines, ['Cold', 'Medium', 'Hot']);
There is a lot more that you can do with outputs (such as including interactive outputs) with your book. For more information about this, see the Jupyter Book documentation